Keyword Volume Relational Accuracy
First, quick disclosure: I am Russ Jones, Principal Search Scientist at Moz and I work directly on the model that predicts search volume.
It is impossible to know the exact search volume for a keyword in Google. The methodologies available to us (Google Adwords Keyword Planner, Traffic Estimator, and Google Trends) are all problematic in one way or another. But this doesn’t mean we are hopelessly lost regarding our predictions of search volume. One thing we can analyze is the relationship between keywords rather than their exact volume. For example, Google Trends doesn’t provide us the exact search numbers, but it does provide us a comparison of keywords. Theoretically, the relationship between 2 keywords in Google Trends (lets say 3:1 because keyword 1 is searched 300 times and keyword 2 is searched 100 times) should be the same in our predictions. That is to say, we should have a 3:1 ratio as well. This sounds like the makings of a quick study – which of the major tools – Moz, Ahrefs, and SEMRush are best at being proportionally accurate relative to Google Trends keywords data.
Methodology
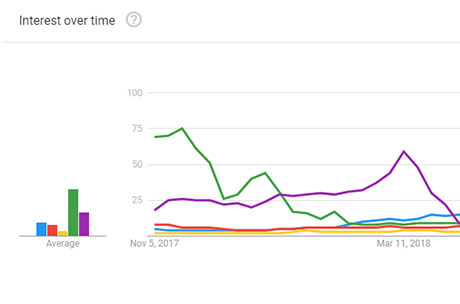
Select several sets of 5 head tail keywords and collect the Google Trends data for annual average keyword volume. I chose head-tail terms because it was more likely that Google Trends would have data for all of them and wouldn’t artificially zero out or put at 100 any of the 5 terms, which would spoil the data. The data looks something like this…
The bar graph you see on the left is the relationship of the 5 keywords. The green keyword is the most popular, the yellow is the least, and we should expect that a good keyword volume model will maintain similar relationships in volume.
We next collect the volume for those groups of 5 keywords from each of the major competitors: Moz, Ahrefs, and SEMRush. We then run simple transformations to put the data on the same 0-1 scale, and finally use simple regression to determine how closely they match. Well, let’s see how they fair.
SEMRush Performance
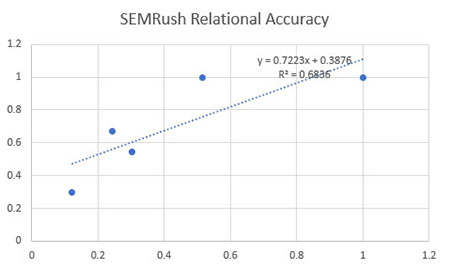
As you can see in this example graph, there is a decent bit of noise in the data. Their r2 is only .68. In many cases, SEMRush not only gets the relationship wrong, they actually get the order wrong. For example, baseball is a more popular search term than soccer according to Google Trends, but SEMRush predicts higher volume for soccer.
Ahrefs Performance
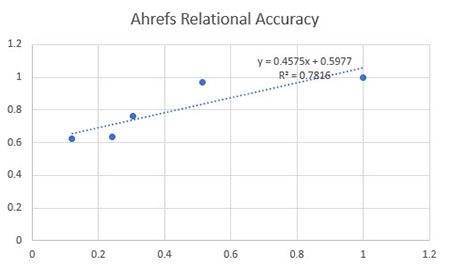
Ahrefs performs better, with an r2 of .78. You can see that the relationship is much tighter. Ahrefs gets the order of keywords right and puts up very respectable numbers.
Moz Performance
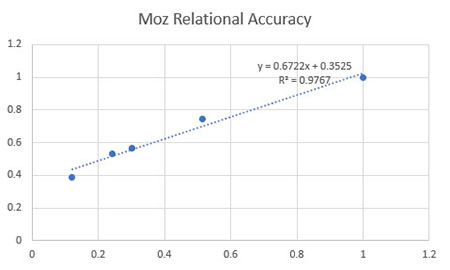
Moz, by far, out performed all in comparing the proportional relevancy of keyword volumes of these sets of 5 terms. With an r2 of .97 we are almost lock-step with Google in relating keywords in terms of volume. Now, of course, this doesnt mean we have the volumes right, it just means we have the relations between volumes right. If you want to compare 2 keywords, you can be more confident in our data that our competitors that one will be greater or lesser than the other, and at what proportion. The actual volume number is impossible to be certain of, but we can express strong confidence that we get the relation correct.
What Makes the Difference?
There is a lot of speculation about what data each of the major providers are mixing in so that they can predict volume. We are certain that each uses clickstream data, and Moz is open about using Jumpshot as our provider. The provider of the clickstream data could be responsible for the disparities in performance. However, what is likely the culprit is the amount of time spent on perfecting the predictive model for volume. Moz updates the volume model every month in order to take into account shifts in corpus size delivered by the clickstream vendor, handling known new biases, and then finally building a custom training set which is most likely to produce a strong correlation. Each organization has to choose what Google keyword volume to build their model on, and the selection process is essential to creating an accurate model. At any rate, I am proud to say that Moz is once again the leader in data quality, because we sweat the details.
Caveats
- This wasnt a huge study, only 100 keywords (20 groups of 5) were included. The results were statistically significant though.
- I work for Moz, so you have to take that with a grain of salt.
- There are other reasons you might want to use a different tool from Moz, all I am talking about here is 1 way to look at volume numbers.


I’ve made similar observations about perceptible differences in estimated search volumes across different tools. Great to see some data on this! Would love to read more on this topic!
Thanks for sharing this Russ. I’d love to see a similar comparison with more keywords, including those with lower search volume. I’d also like to see if the same holds true for the relative keyword volume returned by Keyword Planner for those same keywords. This kind of stuff really makes me wish I’d have taken more statistics classes.
Too small of a sample size.
Author Response Actually, among head tail terms (100K+) this is definitely statistically significant, the sample size is fine. Maybe my selection was biased, and it certainly isn’t large enough to extend to the whole keyword corpus, but it isn’t too small.
Hi
Really interesting but I have one question about you assumption from Google Trends.
As far I understand it, Trends shows relative volume for a keyword
over time. It does not show relative volume between queries.
I do not think that if it shows a 3:1 ratio it means that there is 3 times the volume
What Yacoov says
I agree with the conclusions here, but I must say that AHREF’s crawls a lot more than MOZ last I checked.
Hey Russ,
I had a couple questions about your study:
1. Since Moz gives ranges, what did you use (max, min, average) for this study?
Author Response I used the actual predicted numbers for our volume. We do produce a raw predictive number but do not currently expose it in the tools because we felt that ranges were more appropriate. This is likely to change in the near future.
2. I’m seeing conflicting definitions within Google’s documentation on what keywords are included when searching within Google Trends (https://twitter.com/MyNameIsTylor/status/1058059209907101697). What’s your take? Can we even trust there’s a definitive way to look at a single query in Google Trends, or is there a strong likelihood that it always includes multiple keywords per query? Thanks!
Author Response I am certain that there are inconsistencies in Google Trends data. Unfortunately, we often have to work with muddled data. It would require a much more robust exercise to scrutinize trends in a way that I would feel comfortable publishing to the Moz blog, if that gives you any kind of idea of how much I trust the data.